Table of Contents
1. Introduction to Cumulative Volume Delta
2. Understanding the Basics of Volume Delta
3. The Role of Smart Money in Trading
4. How Cumulative Volume Delta Identifies Smart Money Moves
5. Utilizing Bookmap for Advanced Market Insights
6. Strategies for Using Cumulative Volume Delta
7. Common Mistakes and How to Avoid Them
8. Real-Life Examples and Case Studies
9. Advanced Tips for Experienced Traders
10. Final Thoughts on Cumulative Volume Delta
Introduction to Cumulative Volume Delta
In the fast-paced world of trading, understanding market movements can be the key to success. Traders who can anticipate shifts in market sentiment have a significant advantage, particularly when they can spot early moves by institutional investors or “smart money.” One powerful tool that traders can use to enhance their market insights is the Cumulative Volume Delta (CVD). This technique can reveal the underlying dynamics of market movements by analyzing buying and selling pressure over time.
Understanding the Basics of Volume Delta
Volume Delta is a metric that measures the difference between buying and selling volumes at each price level or over a specified period. It is calculated by subtracting the volume of sellers from the volume of buyers. A positive delta indicates more buying activity, while a negative delta suggests more selling pressure.
How Volume Delta Works
1. Buy Orders vs. Sell Orders: At any given price level, there are both buy and sell orders. The volume delta shows which side is more aggressive.
2. Calculation: If 200 contracts are bought and 150 are sold, the volume delta is +50.
3. Interpreting Signals: Significant changes in the delta can indicate shifts in market sentiment, often preceding price movements.
The Role of Smart Money in Trading
Smart money refers to institutional investors and other large financial entities that have substantial resources and access to information that typical retail traders do not. These entities often drive market trends due to their ability to place large trades and influence price movements.
Characteristics of Smart Money
1. Large Trading Volumes: Smart money trades involve large volumes, making their actions visible through tools like CVD.
2. Access to Information: They have better access to market research and insights.
3. Market Influence: Their actions can move prices significantly due to sheer volume.
How Cumulative Volume Delta Identifies Smart Money Moves
CVD aggregates the volume delta data over time, providing a running total that highlights trends in buying and selling pressures. By analyzing this data, traders can identify potential smart money moves before they manifest in price charts.
Key Indicators of Smart Money Activity
1. Sudden Changes in CVD: A rapid increase or decrease may indicate institutional activity.
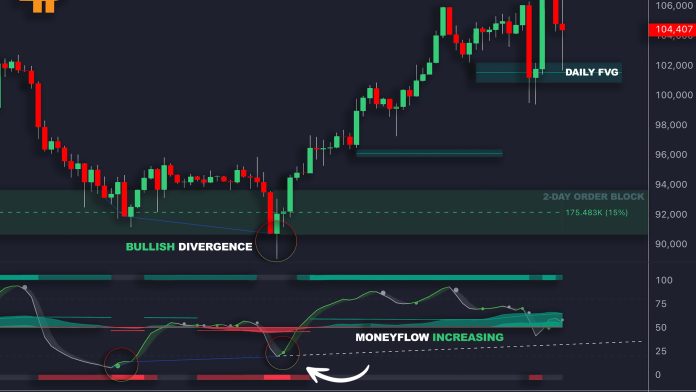
2. Divergences: When price action diverges from CVD trends, it may signal a reversal driven by smart money.
3. Volume Spikes: Large spikes in cumulative volume often correlate with institutional trading.
Utilizing Bookmap for Advanced Market Insights
Bookmap is a powerful platform that offers comprehensive tools for visualizing market data, including CVD analysis. This platform provides real-time insights into the order book depth, enabling traders to see where liquidity is concentrated.
Features Beneficial for Traders
1. Heatmaps: Visualize areas of high liquidity and potential support or resistance based on order flow.
2. Volume Bubbles: Represent trade sizes at specific price levels, helping identify significant trades by smart money.
3. Real-Time Updates: Stay informed with instantaneous data that captures market dynamics as they unfold.
Integrating Bookmap into your trading strategy allows you to gain a deeper understanding of market movements and enhances your ability to spot smart money moves early.
Strategies for Using Cumulative Volume Delta
To effectively incorporate CVD into your trading strategy, consider employing several methods that leverage its insights:
Trend Confirmation
Use CVD as a confirmation tool for existing trends by verifying whether buying or selling pressure aligns with price movements.
Divergence Identification
Identify divergences between price action and CVD trends as potential signals for reversals or trend continuations.
Time Frames Alignment
Analyze CVD across multiple time frames to discern larger trends from temporary fluctuations, enhancing decision-making accuracy.
Common Mistakes and How to Avoid Them
Even experienced traders can make errors when interpreting CVD data. Awareness of these pitfalls can protect you from costly mistakes:
Over-Reliance on One Indicator
Relying solely on CVD without considering other indicators such as moving averages or RSI can lead to misleading conclusions.
Ignoring Market Context
Market conditions, such as news events or economic reports, can heavily influence trading volume and should be factored into your analysis.
Misinterpreting Data
Ensure accurate interpretation by cross-referencing with other signals and maintaining an awareness of broader market trends.
Real-Life Examples and Case Studies
Examining real-world scenarios where CVD provided valuable insights can solidify your understanding:
Case Study 1: Major Market Reversal
In this example, traders noticed a significant divergence between declining prices and rising cumulative volume delta, indicating impending upward movement driven by institutional buying.
Case Study 2: Breakout Confirmation
Utilizing Bookmap’s heatmap feature alongside CVD data helped confirm a breakout above resistance levels, as substantial buying pressure was visible before the price surge.
Advanced Tips for Experienced Traders
For those already familiar with basic strategies, more advanced techniques can fine-tune your approach:
Integrating Algorithmic Strategies
Incorporate algorithmic trading strategies that automate responses based on predefined CVD thresholds to capitalize on quick market shifts efficiently.
Customizing Indicators
Customize your indicators within platforms like Bookmap to highlight specific patterns relevant to your trading style, enhancing precision in decision-making.
Final Thoughts on Cumulative Volume Delta
Harnessing the power of cumulative volume delta provides traders with a competitive edge by revealing hidden patterns in buying and selling pressures indicative of smart money activity. Whether you’re leveraging Bookmap’s sophisticated visualization tools or developing personalized strategies based on these insights, mastering CVD offers pathways to more informed trading decisions and ultimately achieving greater success in financial markets.


