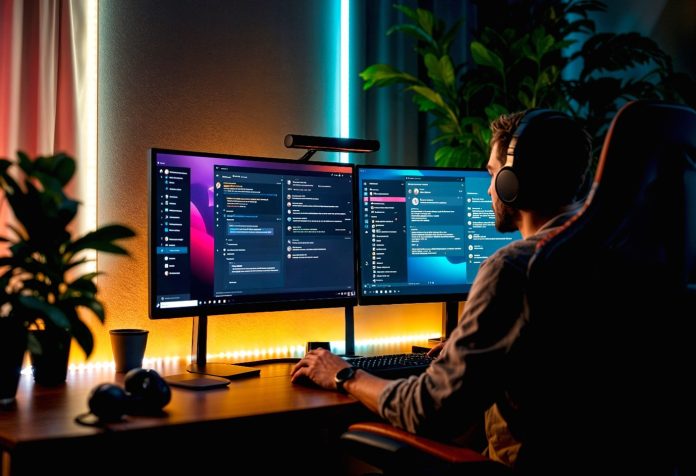
There was a time when data scientists stared at CSVs like they were ancient scrolls. Endless columns. NaN values sprinkled like confetti. Half the job felt like cleaning up after a party you didn’t even attend. And exploration? That meant running the same old scripts, again and again, trying to spot something interesting. It was functional. But fun? Not a chance.
Then came vibe coding.
Yeah, it sounds like something you’d do while burning incense in a bean bag, but it’s way more practical than that. Vibe coding is the rising trend of data exploration that feels more like playing jazz than reading a textbook. It’s about experimenting live, letting intuition lead, and actually enjoying the process.
Let’s break this down. And keep it real.
What is vibe coding, anyway?
Think of vibe coding like live sketching, but with code. Instead of setting up rigid scripts, data scientists poke around datasets like curious cats. You test ideas, visualize on the fly, and adjust as you go. Tools like Jupyter notebooks started the movement. Tools like Streamlit, Observable, and Polars are turning it into a vibe.
It’s fast. It’s reactive. And it’s weirdly satisfying.
Imagine getting a new dataset and instead of prepping a whole pipeline, you just start noodling. A few lines of code here, a quick chart there, some filtering, a bit of color—suddenly the data talks back. You don’t just see patterns—you feel them. No, this isn’t poetry. It’s what happens when data stops being a wall of numbers and starts being visual, fluid, and alive.
Old way: Dry toast.
New way: Breakfast burrito with hot sauce.
Let’s compare.
Old way:
You open a CSV.
You print out df.head().
You get bored.
You write a loop.
You write another loop.
You open Stack Overflow.
Repeat.
Vibe coding:
You open your IDE (or a browser).
You drag in a CSV.
You start poking around with live charts, filters, sliders.
You realize something weird in the data.
You zoom in.
You adjust a parameter.
You change the visual.
It’s 45 minutes later and you’ve discovered something cool without building a pipeline from scratch.
One feels like running errands.
The other feels like a weekend hobby.
Why data folks are falling for it
Let’s be honest. Most data scientists didn’t go into this field to debug pandas indexing problems or argue with matplotlib about font sizes. They came in for the patterns. The puzzles. The ah-ha moments.
Vibe coding brings that back.
It doesn’t mean structure goes out the window. It just delays the boring bits until after you’ve figured out whether your idea even has legs. It rewards curiosity. You can try something off-the-wall without spending two hours setting up folders and docstrings.
Some call it lazy. Others call it efficient. But anyone who’s used it knows one thing—it’s addictive.
The tools are vibing hard
Let’s name drop a bit.
Streamlit made dashboards so easy, even your dog could build one. Sliders, text inputs, plots—plug and play. It’s become the de facto platform for weekend data experiments.
Polars? Think of it as pandas that went to the gym and got a personality. Super fast, and surprisingly chatty when you want it to be.
Observable lets you live-code visualizations like you’re painting with data. Everything reacts in real time. You tweak a number, the chart updates. No reruns. No reboots.
Then there’s ChatGPT and Co-Pilot, whispering suggestions as you go. Need a regex? It’s there. Want to summarize a column full of chaotic user inputs? One prompt and boom—pattern spotted.
Even SQL has joined the party. Tools like DuckDB are bringing that snappy, in-memory action. No server setup. Just vibes.
But wait, isn’t this just procrastination?
Sure. If you’re not careful, vibe coding can feel like rearranging the furniture while ignoring the broken roof. There’s always a risk of playing with charts while deadlines creep up behind you.
But used right, it’s more like sketching before building. You experiment first, build second. The opposite of wasting time.
The real problem isn’t vibe coding. It’s pretending the rigid old workflow was productive just because it looked serious.
Vibe coding says: chill. Let the dataset speak first. Then build the fancy stuff.
How it’s changing hiring, too
Hiring managers used to obsess over “production-ready pipelines” and “experience with Hadoop.” Now they also want people who can explore fast. People who can sense weirdness in the data. Who can test ideas live. Who can go from CSV to insight before the coffee gets cold.
Suddenly, being good at exploratory workflows isn’t fluff. It’s a real skill.
Being able to show a mini-project built in Streamlit or a wild Observable notebook? That turns heads.
No one cares that your code was long. They care that you found something worth seeing.
Data + flow state = weirdly fun
Something strange happens when vibe coding kicks in. You get into flow. You’re not thinking about code structure or doc formats. You’re following curiosity. You test. You fail. You laugh. You retry.
You feel like a kid messing with Lego blocks again. Except this time, the Lego blocks are datasets. And instead of building spaceships, you’re spotting fraud patterns or weird customer behavior or traffic spikes before a sale.
That weird joy of exploration returns. That sense of “wait, what if I just…?” becomes part of your daily routine.
And somehow, it all feels less like work.
It’s not the future. It’s already here.
This isn’t some utopia. People are doing this now.
That team at a startup? They’re building internal tools on Streamlit to test pricing models.
That analyst at a retail company? They’re poking through sales trends using Polars and visual outputs.
That solo dev on a weekend project? Spinning up a quick dashboard and sharing it with friends.
This is happening. Right now. Quietly, casually, and efficiently. Without anyone making a big deal out of it.
The bottom line
Vibe coding isn’t about abandoning structure. It’s about giving your brain some room to explore before you lock everything into place.
It’s about getting back to what made data fun. That first hit of curiosity. That urge to test. To play.
And yes, it’s about getting weird with your datasets. Throwing in random filters. Plotting odd correlations. Asking “stupid” questions. Because sometimes, that’s where the best answers come from.
Vibe coding won’t fix your broken production scripts. But it might remind you why you got into Data Science Services in the first place.
And maybe, just maybe, it’ll make your next analysis feel less like work—and more like discovery.


