In business, you need to have an insight into your data trends. Using the best data visualization software’s turns your data into visuals and makes it easy to understand. Data visualization reveals hidden insights that your team might not see.
Clear visuals are crucial to success in a business because they will give you insights into customer behavior and the company’s performance. To help you pick the best data visualization software’s, we have researched the best data visualization software’s for your business today.
In this blog, we are going to look at the following;
⦁ What is data visualization
⦁ Types of data visualization
⦁ 5 Data visualization tools for small businesses
What is Data Visualization?
Data visualization is graphically representing your data using graphs, charts, or diagrams. Data visualization tools help to see and understand trends, patterns, and outliers in data. It is also an excellent way to represent data to your audience without confusion.
Types of data visualization
There are various ways in which data can be presented. These are;
⦁ Pie chart
⦁ Bar graph
⦁ Statistical graph
⦁ Dot distribution map
⦁ Tree map
Word cloud
5 Data visualization tools for small businesses
ChartExpo
ChartExpo is a visualization plugin for Microsoft Excel and Google spreadsheets. It is almost free software; thus, it is the best visualization software for small businesses. ChartExpo helps you to turn spreadsheets into insightful charts and data visualization. It does not require coding skills; thus, it is suitable for everyone.
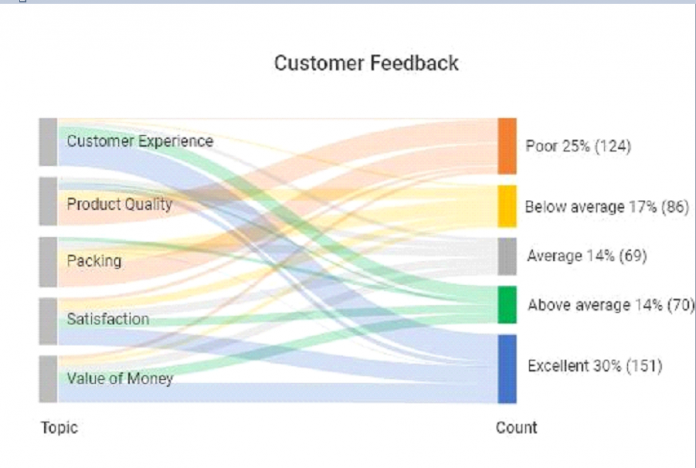
A Sankey diagram of customer feedback generated using ChartExpo.
With ChartExpo as your data visualization software, you can comfortably detect hidden trends in your spreadsheets and complex data sets. Data visualization using ChartExpo is possible due to multiple settings, properties, and tools provided to edit your chart.
These options include colors, fonts, backgrounds, and data components such as an average running line or additional variables.
Importance of using ChartExpo as your visualization plugin
⦁ Boosted productivity
ChartExpo drives your productivity through the roof. It turns your spreadsheet into a one-stop solution for all tasks.
⦁ Create complex charts in excel
Excel does not accommodate all charts such as survey charts and dot plot charts. It only has basic inbuilt charts. While working with complex data sets, these ChartExpo charts are readily available. This makes your work easier since you don’t have to break down your data into smaller sets.
⦁ Provide clear and stunning presentations
ChartExpo helps you create a clear presentation that non-technical audiences understand.
Tableau
Many businesses use this data visualization tool. Tableau creates an interactive visualization while working with complex data sets. The use of this tool with large data sets is ideal.
If your data is dynamic, Tableau can also keep up with changes. Tableau generates charts that are simple to read and understand. It also helps users to understand the information better. Although you require scripting knowledge while using Tableau, it is easy to learn its controls.
Tableau is a good data visualization software for small businesses due to the following reasons;
⦁ Tableau creates interactive visualizations
⦁ it is easy to implement
⦁ Tableau can handle large amounts of data
Google data studio
The best data visualization software for small businesses is Google Data Studio. It is a free reporting tool that aids in time and money savings for business analysts.
Google Data Studio assists small businesses by quickly promoting precise data. You can also use this data visualization tool to make straightforward dashboards and reports that are simple to share with coworkers and clients.
Why google data studio is suitable for small businesses is;
⦁ You can visualize the unlimited size of data
⦁ While using google data studio, you can quickly and easily access google data sources.
⦁ It has customizable dashboards
⦁ Easy to integrate
Infogram
Another best data visualization software for small businesses is Infogram. It has data visualization tools that make it easy to create data visualization using templates. Infogram is a great data visualization software because it lets you inform customers about the goods and services offered by your business.
Using this software, you can add personalized features to your charts, which is another fantastic feature. Videos, maps, and images are among these features. These unique features improve your content by incorporating interactive media to increase its reader appeal.
The advantages of using Infogram as your data visualization software are;
⦁ The ability to add infographics makes the data to be persuasive and eye-catching
⦁ Your visualized data show that you are an expert, thus gaining the trust of your customers
⦁ Infogram makes your data easy to read and understand due to available infographics
QlikView
Considering it has many features, QlikView is another data visualization software for small businesses that produce more customized data. This data visualization tool offers a variety of data visualization strategies for your business. Some QlikView tools include analytics, enterprise reporting, and business intelligence (BI).
In contrast to other softwares that only allow you to use a particular data set, this one can be used with any data source. To understand data trends clearly, you can combine various data sets from different sources.
The reasons you can use QlikView as your data visualization software are,
⦁ It has visual and dynamic dashboards that help to quickly and efficiently interpret and analyze data
⦁ It supports data sharing; therefore, you can work with a team on your business data
⦁ It is possible to compress data up to 10% of its original size using QlikView. This helps to eliminate un- used data.
Wrap up
There is a wide variety of data visualization software for small businesses. The choice depends on data visualization designers on which tools to use.
Some of these tools are powerful and can handle a large amount of data. However, this does not guarantee that picking the most powerful tool is the best idea. For example, these powerful tools take time to power up, while simple tools take little time to finish working on simple data. This proves that data visualizers should take data visualization tools according to the workload.
Data visualization software’s such ChartExpo has a free trial that helps you to familiarize yourself with its controls. Software’s such as these are worth taking a test.


