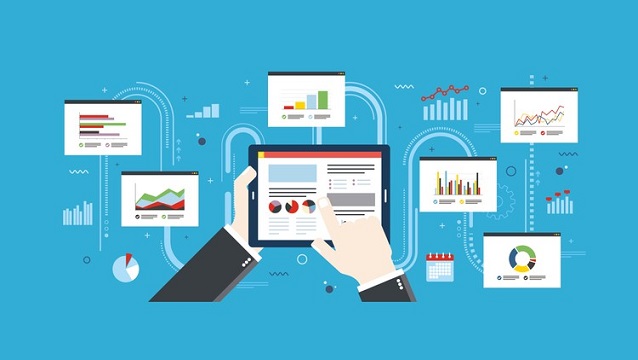
In the modern digital landscape, data has become a valuable asset for businesses across industries. To extract meaningful insights and drive informed decision-making, organizations rely on interactive and visually compelling dashboards.
Dashboard development has emerged as a critical discipline, empowering businesses to present complex data in a simplified and actionable format. In this comprehensive article, we delve into the world of dashboard development, exploring its significance, key elements, design principles, development process, and real-world applications.
The Significance of Dashboard Development
Dashboard development plays a pivotal role in transforming raw data into actionable insights. Dashboards serve as a visual gateway to critical information, enabling stakeholders to monitor key performance indicators (KPIs), identify trends, and make informed decisions swiftly. By presenting data in an intuitive and user-friendly manner, dashboards facilitate better understanding, collaboration, and strategic planning across all levels of an organization.
Key Elements of Effective Dashboards
- Data Visualization: Dashboards utilize various visualization techniques, such as charts, graphs, maps, and tables, to represent data in a clear and understandable manner.
- Interactivity: Interactive elements enable users to drill down into specific data points, filter information, and customize views according to their needs.
- Real-time Data: Dashboards often incorporate real-time or near-real-time data updates, ensuring that users have access to the most current information.
- Key Performance Indicators (KPIs): Dashboards focus on presenting relevant KPIs that align with business goals, enabling quick assessment of performance.
- User-Centric Design: Effective dashboards prioritize user experience (UX) by organizing information logically, using consistent design elements, and minimizing clutter.
Design Principles for Dashboard Development
- Clarity and Simplicity: Keep the design clean and simple to avoid overwhelming users with excessive information. Use clear labels, intuitive icons, and concise text.
- Consistency: Maintain a consistent design language, color scheme, and typography throughout the dashboard to create a cohesive visual identity.
- Hierarchy and Layout: Organize information hierarchically, placing the most critical data prominently and using a logical layout that guides the user’s eye.
- Data-Driven Design: Tailor visualizations to the data being presented. Choose appropriate chart types and formats that effectively convey the insights.
- Responsive Design: Ensure dashboards are responsive and adaptable to various screen sizes and devices to enable seamless access on desktops, tablets, and smartphones.
The Dashboard Development Process
- Requirements Gathering: Collaborate with stakeholders to define the purpose, objectives, and specific data points that the dashboard should present.
- Data Source Integration: Connect the dashboard to relevant data sources, whether from databases, APIs, spreadsheets, or other systems.
- Visualization Design: Design the layout, choose appropriate visualizations, and organize the data to tell a coherent and meaningful story.
- Interactivity and Filters: Implement interactive elements, filters, and drill-down capabilities that allow users to explore the data and gain deeper insights.
- Testing and Iteration: Thoroughly test the dashboard’s functionality, usability, and responsiveness. Gather feedback and iterate on the design as needed.
- Deployment and User Training: Deploy the dashboard to the intended users, provide training if necessary, and ensure ongoing support and updates.
Real-World Applications of Dashboards
- Business Intelligence: Dashboards enable executives and managers to monitor company performance, track sales, analyze market trends, and optimize operations.
- Financial Analysis: Financial dashboards provide insights into revenue, expenses, cash flow, and profitability, aiding in financial planning and decision-making.
- Marketing and Campaign Tracking: Marketing dashboards help track campaign performance, website analytics, social media engagement, and customer behavior.
- Supply Chain Management: Dashboards provide real-time visibility into inventory levels, supplier performance, demand forecasting, and logistics tracking.
- Healthcare and Healthcare: Dashboards aid healthcare professionals in tracking patient outcomes, monitoring medical equipment, and managing healthcare facilities efficiently.
Conclusion
Dashboard development has evolved into a crucial discipline that empowers organizations to harness the power of data for strategic decision-making. By transforming complex data into visual insights, dashboards enhance understanding, collaboration, and efficiency across various industries and domains.
Effective dashboard development hinges on a user-centric design approach, combining data visualization principles with intuitive interactivity. As businesses continue to rely on data-driven insights, dashboard development remains a cornerstone in enabling timely, informed, and impactful decision-making.
With its ability to present complex information in a simplified and actionable format, dashboard development serves as a powerful tool for unlocking the potential of data and guiding organizations toward success in the digital age.


